→ Introduction to Technical Analysis
What is Technical Analysis “Technical analysis” is an industry term that more often than not sounds much more complicated than the actual process is. Really, it ought to be referred to as “price analysis”, as this would be a more accurate description. Through the use of charted data traders around the world analyze their market of choice. The objective: determine future price movement. The means: understanding price movement patterns of the past.
The charting of price movements creates a visual tug-of-war between buyers and sellers. The large majority of Technical traders in the Forex market focus their attention on candlestick data, a method of charting that offers a visual interpretation of the high, low, open and close of a currency price within a certain time frame. Combined with various forms of pattern recognition (which will be covered later in the course) candlestick charting offers traders a visual look at the market’s past prices and trends. Analyzing this historical data in order to predict the movements of future prices is the process known as “technical analysis”.
Why Does Technical Analysis Work? Technical analysis is often dispelled as a myth, even a fool’s errand. There are those who believe that price movement is completely random and completely unpredictable. True, technical analysis is never an exact science (predicting the future never is). However, the true fool would be he or she that ignores the power of technical analysis, particularly in the Forex market.
Analyzing price patterns is actually very similar to analyzing human behavior. While humans can at times be unpredictable in nature, humans are typically considered to be creatures of habit. The average human adheres to certain paradigms, paradigms that are rarely broken. Do you brush your teeth or shower first? Do you comb your hair before or after you shave? The point: if one were to observe an average person’s daily routine before leaving the house for work their behavior may seem random or without purpose. However, if one were to observe the same human day after day, within a relatively short amount of time it would not be hard to outline that person’s morning routine. In fact, nine times out of ten you would probably be able to predict with impressive accuracy how your observed creature would prepare for their day, perhaps even down to the minute.
The Forex market is also a creature of habit. Analyzing price movement is effective because the past can teach us how human beings (the real living and breathing organism of this market) will react to certain situations. History does repeat itself. Technical analysis offers the Forex trader a certain level of expectancy when considering future price movements. In a sense, accurate technical analysis is a trader’s true edge. There is no crystal ball for predicting the future of the market, though there are keys to understanding patterns, past, present and future.
When Does Technical Analysis Fail? Technical analysis fails when traders fail to consider the fundamentals. Why mention fundamental analysis when explaining technical analysis? Simple, the one just doesn’t work without the other. Fundamental factors such as political events, a hike in interest rates, unemployment rates and so on will impact the Forex market more substantially than perhaps any other market. Fundamental factors are often the driving force of major price movements. A trader focused on technical analysis cannot ignore Non Far Payroll on the first Friday of the month and expect his or her technical indications to be as accurate as the day prior. Purely technical traders understand that certain political factors throw all other price forecasts out the window.
→ Pattern Recognition
Double Tops & Double Bottoms Double Tops do not only provide technical traders with a firm indication of a beginning downward trend; they also prove that price movement is not random, but rather is a clear indication of market sentiment. Double Tops occur when a new high is plotted, raising the resistance level. The price then retraces and declines, only to rise again and reach the same high or resistance level.
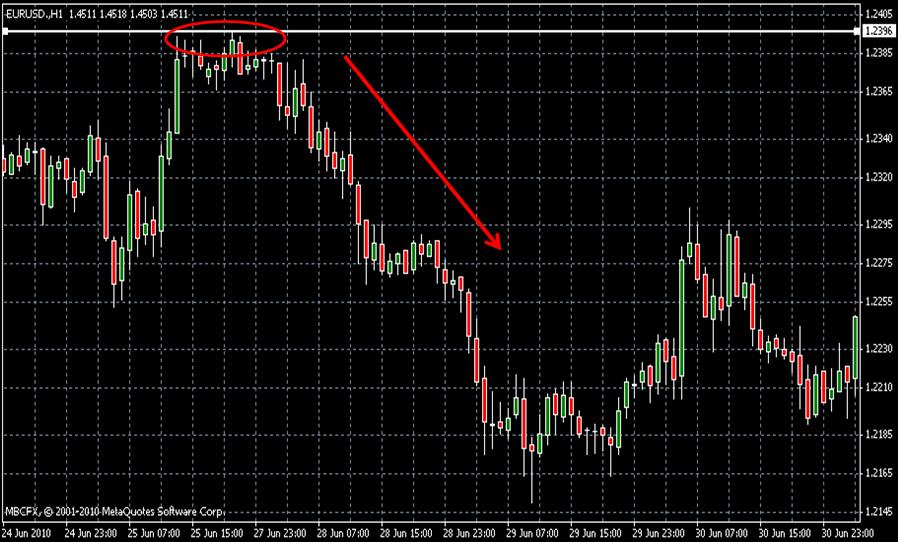
As can be seen in the image above Double Tops can be thought of as true market sentiment. Traders around the globe push the price to a new high; because the new high is a tad extreme the price is subsequently brought back down. Again traders push up to the same level, testing it just one more time; again the price feels too extreme. The market has decided that an upwards trend is just not in the cards, twice a new high was tested and twice the market sold to push it back down. After noticing a Double Top a trader is very safe to assume that for the time being the market will move in a downwards trend, thus affording an opportunity to sell, or exit a soon to be falling long position.
Of course, Double Bottoms are just the opposite of Double Tops. Twice the market will test a new low, and twice the market will refuse the idea of pushing beyond that point. The buyers will rally and an uptrend will follow.
Triangles There are three types of triangles that technical traders focus on:
(1) Ascending Triangle
(2) Descending Triangle
(3) Symmetrical Triangle
Ascending triangles are considered bullish pattern formations, though depending on whether they are formed during an up-trend or a down-trend they may have different implications towards future price movement. Spotted within an up-trend an ascending triangle is typically considered an indication that the upwards trend will continue. Just the opposite, if an ascending triangle forms during a downwards trend it is considered an indication of a trend reversal. Essentially, ascending triangles are comprised of a series of candles that, in accordance with the pattern’s name, form the shape of a triangle. The term ascending triangle refers to the fact that the triangle’s two trend lines are not created equally; the top line of the triangle will represent a fairly even level of high prices, while the lower level of the triangle will represent a continued series of higher lows. The consolidation between buyers and sellers at an upward slant suggests pressure from the buyers. The resistance line can typically only hold for so long before the buyers get the best of the sellers and the price breaks out in an upwards trend, at which point the resistance level often becomes the new support level; or for a seasoned trader, a wise level to place a stop loss. The image below shows an example of an ascending triangle. As can be seen, it is generally safe to assume that the triangle will break out at least five candles before the actual point of the triangle would form.
Descending triangles , naturally, are just the opposite of ascending triangles. In a downwards trend the triangle forms as an indication that the trend will continue downwards. In an upwards trend the triangle forms as an indication of a trend reversal. Descending triangles are formed when there is a series of progressively lower highs and relatively even lows. As can be seen in the image below the top line or resistance line of the triangle will be angled down, while the lower line or support level will appear as a level horizontal line.
Symmetrical triangles are most often considered a continuation pattern. Symmetrical triangles can be seen as a series of lower highs and higher lows develop forming the shape of a triangle. This pattern represents a struggle between buyers and sellers, as is usually the case with price consolidation; more often than not symmetrical triangles precede a price breakout. Though it is generally safe to assume that symmetrical triangles will only present themselves as an indication that the current trend either upwards or downwards will continue, this may not always be the case. The good news for seasoned traders is that one need not really know ahead of time where the market will head, the true key is simply to spot the symmetrical triangle developing. As can be seen in the example below once the support or resistance line of the triangle has been penetrated by two to three consecutive candles the trend will more than likely continue in that direction, thus offering traders an excellent entry point.
Wedges Wedges are often considered a difficult pattern to recognize, and or are often confused with triangles. The distinction between wedges and triangles is actually quite clear to the trained eye. The key to spotting the difference is found in the slant or the angle of the support or resistance line. When observing triangles notice that ascending triangles show a flat or even resistance line, conversely descending triangles show a flat or even support line. Symmetrical triangles, as their name suggests, are neither slanted downwards or upwards.
There are two types of wedges; rising wedges and falling wedges. Falling wedges are considered bullish pattern formations. When found in a downwards trend the falling wedge suggests a reversal of that trend. When found in an upwards trend the falling wedge suggests a continuation of the upwards trend. The falling wedge is formed by a series of lower highs and lower lows. Notice that both the support and resistance levels of the wedge are slanted downwards, setting the wedge aside from what might be mistaken as a triangle pattern formation. Prices within the falling wedge will continue to tighten until the resistance line is finally penetrated and the breakout upwards begins. Timing a falling wedge is much like timing a triangle formation; one can generally assume that after two to three candlesticks have pushed through the resistance line it is then time to consider hoping on the bandwagon with the rest of the buyers.
Rising wedges, just the opposite of falling wedges, are considered bearish pattern formations and are represented by a series of continued higher highs and higher lows which are narrowing or consolidating. The rising wedge suggests to the trained eye that though the buyers are reaching new highs, these highs a progressively tighter and tighter. These progressively tighter highs indicate that the upwards trend is losing steam. Thus, a rising wedge found in an upwards trend would suggest a trend reversal and a rising wedge found in a downwards trend would suggest a short rally from the buyers, but ultimately a continuation of the downwards trend. See image below:
Flags & Pennants Flags and pennants are perhaps the most common of continuation patterns. Spotting a flag or a pennant usually begins with noticing the flag pole, or for more practical purposes, the trend line. Flags and pennants typically form after a substantial trend up or down as an indication that the price is consolidating, or being tested before continuing in the initial direction of the trend. Often the consolidation period (the flag or pennant) is slanted in a direction opposite of the initial trend, this demonstrates the market’s hesitation to continue upwards or downwards, but ultimately it is nothing more than a brief hesitation and an indication to the trained eye that there is safety in staying with the initial trend. Though both flags and pennants indicate a continuation of the current trend, there is a distinct visual difference between the two. The flag will be represented by a more rectangular consolidation period, both support and resistance levels will be about an equal distance from one another. A pennant on the other hand will be represented by support and resistance levels that are moving towards one another in the shape of an asymmetrical triangle. Both the flag and the pennant are always spotted at the end of the flag pole, or at the end of a sharp directional trend.
Head & Shoulders / Reverse Head & Shoulders Usually found after a long trend either up or down, as its name suggests head and shoulders are named after the human form. Consisting of three peaks, one of which (the head) is centered and higher than the two lower and relatively equal peaks (the shoulders). Head and Shoulders is perhaps the most well known reversal pattern within technical analysis. Formed after a long upwards trend the left shoulder begins to form while still in the upwards trend. Essentially the left shoulder forms as prices rally up and quickly thereafter retrace, typically the upwards trend line, or resistance level will not be broken as this happens. Notice that the left shoulder seen alone can also be viewed as a forming flag. As the left shoulder finds its end, prices again rally, this time to a new high which will become the head of the pattern. After the high peak or head of the pattern is formed and prices have retraced back down, again prices will rally to near the same level as the left shoulder to form the right shoulder. Essentially, within an upwards trend prices have attempted to rally three times and each rally has seen limited success, or in other words has been rejected by the sellers. Once the right shoulder breaks through the imaginary support line equal with the right shoulder (the neck line) the reversal of the trend has officially begun. Buyers have tried to continue the upwards trend, and three times have lost their battle to the sellers. A trader who has spotted a forming head and shoulders pattern can usually be quite sure that he or she has seen the end or a long upwards trend. It’s time to cut your losses, secure your profits, or short the market.
Every pattern within technical analysis seems to have its opposite, head and shoulders is no exception to this rule. Reverse head and shoulders represent essentially the same situation as normal head and shoulders, but of course are found in long term downwards trends as opposed to long term upwards trends. Instead of the head and shoulders represented by new peak highs they are represented by new peak lows. The reverse head and shoulders tips the trader that the downwards trend is losing steam as three new lows have been tested and each time bested by the buyers in the market. Again, it’s time to cut your losses, secure your profits, or this time, long the market.
→ Support And Resistance
The concept of support and resistance in the charts is basic to the understanding of price patterns and their implications.
Edwards & Magee defined support as the “buying, actual or potential, sufficient in volume to halt a downtrend in prices for an Appreciable period.” Resistance, of course, is the antithesis of this and consists of selling, actual or potential, in sufficient volume to keep prices from rising for a time. “Support and resistance, as thus defined, are nearly but not quite synonymous with demand and supply, respectively."
Further expounding this concept, Edwards & Magee tell us:
“A support level is a price level at which sufficient demand for a stock appears to hold a downtrend temporarily at least, and possibly reverse it. i.e., start prices moving up again. A resistance zone by the same token, is a price level at which sufficient supply of stock is forthcoming to stop, and possibly turn back, its uptrend. There is, theoretically, a certain amount of supply and a certain amount of demand at any given price level... But a support range represents a concentration of demand, and a resistance range represents a concentration of supply.”
Support and resistance – in their basic forms – are represented on the charts as follows:
In a trending market, especially one in which prices travel within the confines of a clearly defined channel, the support and resistance lines will tend to keep prices within the channel, bouncing from support to resistance in an alternating “zigzag” pattern.
Support and resistance are more than just an upward trending or downward trending channel lines. They may be encountered from a variety of chart patterns and other places of price congestion on the charts.
One rule of thumb for determining where a market or security will meet with either support or resistance on the charts is to find previous chart areas where consolidation has occurred. If, for example, a particular stock has stalled out in a net sideways or other congestion pattern at a certain level in the recent past before falling to a lower level, it is all but likely that the stock will encounter difficulty in penetrating that same level later on as it rallies and tries to overcome it. This, of course, does not necessarily mean the former area of consolidation (in this case, resistance) will prove impenetrable; to the contrary, it will probably be overcome eventually. But not without considerable effort on behalf of the buyers. The greater the congestion, the greater the effort required to overcome that congestion, whether it is in the form of support or resistance. Thus support and resistance serve as checks in the development of a trend (be it a rising or a falling trend) to keep the trend from moving too far, too fast and thus getting out of hand and eliciting violent reactions. (This does not apply, of course, in market crashes or “buying panics,” in which case support and resistance levels become meaningless. But such instances are fortunately quite rare.
This leads us to the next related principle of support and resistance which Edwards & Magee elucidate for us:
“…here is the interesting and the important fact which, curiously enough, many casual chart observers appear never to grasp: These critical price levels constantly switch their roles from support to resistance and from resistance to support. A former top, once it has been surpassed, becomes a bottom zone in a subsequent downtrend; and an old bottom, once it has been penetrated, becomes a top zone in a later advancing phase.”
Thus, if a certain security breaks through an overhead resistance level at, say $50, then the moment prices are above the$50 level, it automatically becomes a support. Conversely, if the $50 in our hypothetical security had been a support checking prices from moving below it and the $50 level is suddenly penetrated then $50 automatically becomes resistance. This principle, which we call the “principle of interchangeability,” hold true for older levels of support and resistance as well, not just recent levels.
Other instances of support and resistance can be found not only in areas of chart congestion but in geometric chart patterns as well. The symmetrical triangle affords just such an example. Throughout the formation of the triangle, the upper and lower boundary lines serve as resistance and support, respectively. However, an even stronger level of support level of support and resistance (depending on which direction prices take upon breaking out from the triangle) is provided by the apex of the triangle. By drawing a horizontal line from the apex and extending it across the chart an analyst will be provided with a reliable support/resistance level. However, such levels usually become weak as time passes. Thus, a chartist will want to regard this as a strong support/resistance only in the days/weeks immediately following a price breakout from the triangle.
Concerning volume, it is sufficient merely to point out that the power of a resistance (or support) range is estimated by using the criterion of volume. In other words, the greater the amount of volume was recorded at the making of a top (resistance) or bottom (support) in a given market or security, the greater the strength of that top or bottom will be and the more effort will be necessary to penetrate it in the future. As Edwards & Magee put it:
“In brief, a single, sharp, high-volume bottom offers somewhat more resistance than a series of bottoms with the same volume spread out in time and with intervening rallies.”
Another criterion Edward & Magee discuss that is worth noting here is the extent of the subsequent decline from a resistance zone. Or, to phrase it differently, how far will prices have to climb before they encounter the old bottom zone whose resistance potential the analyst attempt to appraise? “Generally speaking,” Edwards & Magee write, “the greater the distance, the greater the resistance.”
In other words, the higher that prices must travel before breaking the previous top, the stronger the resistance that top is likely to hold.
Finally, in answer to the oft-asked question as to what exactly constitutes a legitimate “break” of either support or resistance, we would refer the analyst back to the old Edwards & Magee “three percent rule,” which states that a break above a support or resistance level (or through a corresponding chart pattern) by distance of at least 3 percent, and accompanied by increased trading volume, should be viewed as the start of a new trend and therefore followed.
→ Moving Averages
Moving Averages Most literature written on technical analysis, more specifically technical indicators, begins with Moving Averages. The reason for this is simple; they are considered by most analysts the most basic and core trend identifying indicators. As its name would suggest a moving average calculates an average of price range over a specified period. For example, a 10 day moving average gathers the closing prices of each day within the 10 day period, adds the 10 prices together and then of course divides by 10. The term moving implies that as a new day’s closing price is added to the equation, the day that is now 11 days back is dropped from the equation.
The example above outlines what would be considered a Simple Moving Average. There are at least 7 varieties of moving averages, but generally the average Forex trader is focused on just one of the following three: Simple Moving Averages, Exponential Moving Averages, and Weighted Moving Averages.
Before examining the various calculations and types of moving averages it is essential that we as traders understand what a moving average is trying to tell us. Its message is really quite simple, and is primarily focused on market expectations. A moving average calculating the last 30 days of prices in the market essentially represents a consensus of price expectations over that 30 day period. The example below shows a moving average line across a basic candlestick chart.
Understanding a moving average is at times as simple as comparing the market’s current price expectations to that of the market’s average price expectations over the time frame that you are viewing. The average gives us a bit of safe zone or a range that traders globally are comfortable trading within. When prices stray from this safe zone or from the moving average line a trader should begin to consider potential entry points into the market. For example, a price that has risen above the moving average line typically implies a market that is becoming more bullish, traders are on the up, and with such will come good opportunities to buy. Just the opposite, when prices begin to fall below moving average lines the market is becoming visibly bearish; traders should thus be looking for opportunities to sell.
Notice the angle of the moving average shown above at various points across the chart. Moving averages not only give traders a much smoother look at the true trend of the market, they also offer keen directional insight found in the angle of the moving average line. Erratic sideways markets tend to be represented by moving average lines that are flat or sideways, whereas markets that are beginning to trend strongly in one direction or another will begin that trend with a very angled moving average line. Remember, it is one thing to look at a completed moving average line and determine at what point would have been an excellent entry into the market, it is another thing to spot the angle of the line as it is developing and at that point wisely enter the market. A true technical analyst is after what the moving average can tell him or her about the coming hours or days of the market, not what the moving average can prove about what should have been done in the past. That said, look for angles!
Simple Moving Averages Calculating simple moving averages is really quite simple (no pun intended). As was outlined in the beginning of this section the sum of all closing prices is divided by the number of days in the equation. With each new day the now oldest day that is no longer a part of the time frame is subsequently dropped from the equation. A simple moving average is considered a lagging indicator. In fact, the simple moving average perhaps epitomizes the meaning of lagging indicator in that its visual data often comes a bit after the fact, and can be hard to act on. Nevertheless, simple moving averages are key to understanding the markets general feel of where the price rage should be trading at, or the safe zone that we referred to earlier. When prices begin to break away from the moving average line in conjunction with a sharply angled moving average line – basic mathematics is predicting a move up or down in the market. The notable down side is that when observing lagging indicators, this prediction often comes too late; thus the reasons for other types of moving averages, averages that more heavily weigh recent data and can offer quicker predictions:
Exponential & Weighted Moving Averages Exponential and weighted moving averages attempt to resolve the issue of lagging directional forecasts. In other words, they often cut to the chase faster, allowing traders to better time the market. This is done by placing greater emphasis on more recent price data. Instead of evenly distributing plotted points of a moving average across all candles in the period, a weighted or exponential moving average puts more emphasis on the most recent data; allowing the angle of the moving average to react more quickly. Theorizing that most recent price data is more important to the immediate future of the market than is older price data is often true, but can certainly be a trader’s demise if he or she is not careful. Trading a heavily weighted 10 day EMA (exponential moving average) and jumping the gun on an initial angle up on the EMA when just 10 to 12 days prior a very strong and long down trend occurred might be a bit naïve. Why? It is simple, Your 10 day EMA is over looking data that is an accurate reflection of recent market sentiment, or price direction. Remember, reading moving averages is about comparing an average view of the market’s recent trends to an actual view of recent price data. In other words, is the market trading within its safe zone, or where its average has been lately? If not, it may be an indication of a new direction or trend, but before you pull the trigger cross check your SMA (simple moving average) and gage an evenly weighted average of the market’s recent history.
Whether using exponential moving averages, weighted moving averages or simple moving averages the objective does not change. You are looking for an average in which the market has been trading. When new candles push significantly through this average in conjunction with a sharply angled moving average line it is time to consider an entry point. History has proved itself; when prices begin trading above the moving average line the market is becoming bullish and traders should be looking for buy entry points. When prices begin trading below the moving average line the market is becoming bearish and traders should look for an opportunity to sell.
20 Days & the Moving Average Cross There are those who pretend that they understand why the 20 day moving average is such a popular choice of today’s Forex traders. The answer may simply be that the average charting software offers this time frame as a default setting, or it may be that minus the weekends this time frame represents about a month of market activity. Whatever the case may be, an increased number of traders around the world follow this number, and thus theory becomes reality. In other words, why do technical indicators often work as well as they do? Well, market sentiment is everything; remember human beings drive any financial market. If enough human beings believe in the same indicator and the same time frame for that indicator, often there is no better way to go than with the crowd. Market sentiment when shared by the masses most often becomes market reality. That is why an untrained trader often finds him or herself baffled by a price move that does not make any logical sense. But, perhaps this trader was unaware of the fact that after a large and intense move up in the market technical analysts around the world were all looking at the same Fibonacci retracement levels (material for a later course, no need to fret). As such, everyone believes that the market will retrace at the same Fib levels and so everyone begins to sell at the same level, thus pushing the market down; sentiment becomes reality. For this very reason it is imperative that anyone serious about trading the Forex market, or any market for that matter, must first learn the basics of technical analysis. Often technical analysis and market sentiment are one in the same.
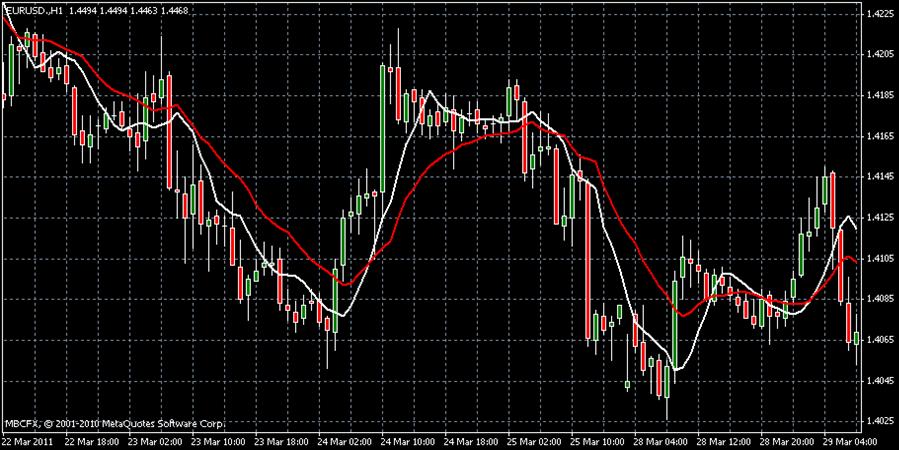
The moving average cross is a tool that should not be overlooked. As can be seen in the above image there are two moving average lines plotted on this chart. The idea is to combine a short term moving average with a long term moving average. For example, a 10 day moving average on top of a 20 day moving average. Of course the shorter moving average period will react more quickly to price direction, whereas the longer moving average period will be represented by a smoother less volatile line. When the two lines cross this is considered an indication of a quickly approaching trend reversal or change in price direction. As always, watch for the angle of the moving average line, particularly the shorter time frame (in this case the 10 day moving average). When lines cross with a sharp angle and an obvious separation from one another nine times out of ten a trader can count on a change in price direction. Do not trust moving average crosses that are represented by lines on top of one another. The two periods might have crossed, but if there is not a sharp angle and a good degree of separation after the cross expect a sideways market for the time being.
When trading moving average crosses follow these rules: when your shorter moving average period crosses the line representing your longer period from the bottom – look for an opportunity to buy. In other words, the market in this situation is most likely poised for a trend upwards. When your shorter moving average period crosses the line representing your longer period from the top – look for an opportunity to sell. The market in this situation is most likely poised for a trend downwards. Take a look at the following chart; notice that the angle of the cross and the separation of the cross are the keys to large changes in direction.
Don’t jump the gun! Often inexperienced traders assume that a moving average cross is a perfect entry at the exact point of lines intersecting. This is usually not the case. Do not be fooled by what may become nothing more than a sideways market. Again, look for sharp angles and an obvious degree of separation between the two lines. Looking back at the image above, notice that the solid trends all have two things in common; the shorter period line has a sharp angle up or down, and the two lines are separated by what would be at least 2 or 3 numbers on a clock. Once this separation is obvious and a few candles have opened higher than the previous (lower than the previous in the case of a downwards trend) the market has shown its true colors. At this point, you should be looking to pull the trigger.
→ Trading with two moving Averages
What They are and How to Use Them for High-Impact Results Using two moving averages – one of shorter length and one of longer length – to generate trading signals is commonly used among traders today. This method, known as the “double crossover method,” is especially suited for securities that happen to be in trending, as opposed to range-bound markets. (Trending markets are characterized by steady upward price movement in bull markets and steady downward price movement in bear markets. Prolonged sideways movement with little sustained progress up or down is characteristic of “range bound” markets.)
There are many different ways in which this double crossover method may be used. The combination possibilities are endless. The two moving averages can be daily or weekly, but one must always be of a shorter time frame than the other. For example, you might consider using a 12- and 24- day moving average in conjunction with security’s price chart. Or a 10- and 30- day, or (as in the chart examples we provide here, a 30-day and 60-day average).The shorter moving average measures the short-term trend, while the longer MA measures the longer-term trend. Buying and selling signals are given whenever the two cross over or under one another.
Trading rules for the double crossover method are quite simple: whenever the shorter-term moving average crosses above the longer-term moving average – and the longer-term MA happens to be rising – a buy signal is generated. Conversely, whenever the shorter-term average falls beneath the longer-term average - and the longer-term average happens to be falling – a sell signal is generated.
BigCharts.com provides a free charting service through its internet site (www.bigcharts.com), which contains charting tools for constructing several varieties of moving averages. The daily and weekly bar charts on the BigCharts.com Web site can be modified to the time frame that best suites the trader. Included in this chapter are a number of BigCharts.com stock charts, and the buy or sell signals they generated based on the crossover method using the 30-day 60-day moving average. Bear in mind that the same rules that apply for interpreting the 30-day and 60-day moving average combo apply for all types of double series moving averages; and can be used for all time frames, including daily, weekly and monthly charts.
J.P. Morgan (JPM) Here is a fine example of how the double crossover system of moving averages works in J.P. Morgan. Here, the daily chart provides a buy signal when the shorter 30-day moving average crosses over the longer 60-day moving average. Conversely, a sell signal is flashed when the longer of the two averages (60-day) crosses over and remains on top of the shorter average (30-day). This basic rule of thumb applies for moving averages of any size and not just the 30-day and 60-day functions. Notice in March 1999 that the first buy signal was given as the 30-day average (light colored line) crossed on top of the darker 60-day line. So long as the price bars were rising and remained on top of the averages, the buy signal remained intact. This was the case from March through June 1999, at which point the price line dropped underneath the averages and the averages started turning down, indicating a loss of momentum. In August 1999 the 60-day average crossed on top of the 30-day average, flashing a sell signal. This continued until November, when another buy signal occurred. However, since the two moving averages got so far out of synch with one another, it warned the trader to avoid making a commitment to the stock until the averages got back in line. The next “in-line” buy signal occurred In August 2000 (note how the two averages interacted at this time on the chart). Because the two averages became widely spaced apart shortly after this signal, it indicated that an over-bought condition was developing in J.P. Morgan. Therefore, the prudent trader would have been right to look for exit signals. The first such signal came in October, at which time the 30-day average turned down and failed to support the price line. Even though a crossover did not occur until one month later, it would have been wise to sell out when the first 30-day moving average turned down. The rules for interpreting single line moving averages still apply when interpreting double line moving averages, even when the two lines have not crossed over yet.
Standard & Poor's Depository Receipt (SPY) A buy signal in the Standard &Poor’s Depository Receipts (SPY) remained in place throughout 1999 until August of that year until the two moving averages started rounding off and turning down. Shortly thereafter, a bearish crossover occurred, though it would have been wise to exit long positions as soon as the moving averages – particularly the 30-day average – starting curving over, reflecting waning momentum. Another strong buy signal was given in November 1999, when the 30-day average crossed the 60-day average. It soon starting curving over, however, and the price line began a prolonged sideways movement into the year 2000. The next formal sell signal was flashed in September, at which time the 60-day average crossed over the 30-day average. The sell signal remained in place through the remainder of the year.
General Motors (GM) General Motors provides a clear sell signal in its daily chart In May 1999 (note crossover and downward curve of moving averages and their relation to the price line). A buy signal was given in October 1999 (note bowl-shaped bottoming pattern of moving averages, the rising price line in relation to the rising averages and the crossover of the shorter average (30-day) on top of the longer average (60-day). The next sign of trouble came in May 2000, when the two averages got out of line with both curving over. The price line plunged through both of them before bouncing higher. This should have been the trader’s signal to exit all long positions in GM and sell the stock short. Remember, when trading using two moving averages, you do not necessarily have to await a crossover before making a trading commitment – a simple curve of one or both of the moving averages, or a failure of the moving averages to contain the price line is all the signal that is required. The crossover serves more or less as a confirmation to the preliminary buy or sell signal.
DuPont (DD) Here is a daily chart of DuPont (DD), a leading industrial stock and a component of the Dow Jones Industrial Average. A strong buy signal was given in April 1999, when both moving averages were close together and moved up at the same time while the price bar were also rising. A separation of the two averages occurred between May and June of that year, followed by a curving over of the shorter (30-day) moving average in June. This provided a preliminary sell signal to the alert trader. An all-out sell signal was given in September when the 30-day average fell below the falling 60-day average. This was followed by falling prices and then a short-term buy signal in December 1999. However notice that in the month between December 1999 and January 2000, even as DuPont’s price line was moving higher, the 30-day moving average ascended while the 60-day average never followed suit. Instead, the 60-day moving average, after a short rise in December, quickly turned back down and continued to curve lower even as the 30-day average was rising. This is what is known as divergence, and it is typically bearish. In cases like these where one moving average gives a buy signal while the other give a sell signal, it is best to exit long positions and either await a clearer signal before re-establishing trading positions or else sell short (if you are an aggressive trader). The longer of the two averages holds more significance, so in this case the fact that the 60-day average was falling implied that the longer-term trend was still down; therefore, short positions were justified. The sell-off continued throughout the year 2000; however, notice how the two averages had moved close together and were starting to round off in bowl fashion. This provides a clue that the sell-off likely has halted and that accumulation could be underway. The trader should watch this chart carefully in anticipation of the next buy signal.
Cisco Systems (CSCO) A bullish buy signal continued throughout 1999 and into the early part of 2000. Notice, however, that the moving averages began moving apart in early 2000 and continued to spread apart into April, at which time the 30-day moving average started to curve over with the 60-day average soon following suit. The first sell signal was given in April when the price line for Cisco Systems fell through both averages. Although there was quick bounce back, the curvature of the averages plus the fact that the price line had previously plunged through them, was strong evidence that Cisco’s bull market had ended and that further weakness could be expected.
China dotcom Corp. ( CHINA) The chart provided on the next page for China dotcom Corp (CHINA) is a great example of how a moving average system can serve to protect traders from adverse moves in the stock market. After an extraordinary advance from its initial public offering in July 1999, CHINA proceeded to rise to a price of nearly $80 a share in March 2000. The large gap between the price line and the moving averages that occurred in March 2000 (just before the crash) was a preliminary warning that the stock was due a significant pullback. Although there is no hard-and-fast rule as to just how far the distance between the price line and moving average should be before a sell signal is given, it is up to the trader to use discretion based on the “average” distance between the two over the long-term. Whenever it becomes plainly evident that there is a wide separation between the moving average and the price line, the trader should prepare to either sell or sell short. Notice also how both averages – particularly the 60-day average – began losing momentum and curving over just before the sell-off occurred. This was yet another advance warning that a plunge was imminent. After the initial crash, CHINA continued to trade below the two moving averages for the rest of the year, indicating that selling pressure was intense throughout.
Boston Properties (BXP) The chart for Boston Properties (BXP) served as a wonderful guide for making profits over a two-year period. Using the double moving average system, a trader, after initially buying in April 1999, knew to sell short between May and June of that year as the gap between the 30-day and the 60-day moving averages widened conspicuously. The sell signal was confirmed in July as the averages crossed over. The trend remained down until December 1999, at which time a preliminary buy signal was flashed as the two averages bottomed and turned up together (the crossover occurred the next month). After a rocky start in the initial months of 200, a firm buy signal was flashed in March, and from there prices headed higher. A preliminary sell signal was given in September 2000, as both averages lost momentum and curved over. Although the next firm buy signal had not been given as of December, it was beginning to look like a distinct possibility. Note how both averages are very close together and appear to be turning up with the price line moving higher. However, as a clear-cut buy signal has not yet been flashed it is safest to remain on the sidelines awaiting a clear signal. Both averages must turn higher before a long position can be safely established.
Resource Asset Investment Trust (RAS) Resource Asset Investment Trust (RAS) is a dynamic stock that can be traded with wonderful results using a double moving average trading system. Note here the interplay between its 30-day and 60-day moving averages. Note especially how the two lines cross through each other at critical turning points along the timeline. Whenever the 30-day moving averages crosses through and above the rising 60-day average, it always precedes a big run-up in share price. Note also how well the averages tend to act as support and resistance for the price line. The first significant buy signal came in May 1999 when the 30-day MA crossed through and above the 60-day MA. Both curved over in August, at which point the trader should have sold short. A ”rounding” process occurred between November 1999 and July 2000 during which time both the price line and the averages produced a bowl-shaped curve, implying accumulation was taking place. The next buy signal was finally flashed in July 2000, which saw RAS rocket from its low near $10.50 to a high of nearly $13 in three months – a hefty percentage gain. After a prompt sell-off from the October high, the averages curved over and failed to support the falling price line, at which time the trader should have sold. By December, however, the 30-day moving average appeared to be ready to cross through the 60-day average, which would send another buy signal.
→ MACD
MACD (Moving Average Convergence / Divergence) After delving into the world of moving averages there is no better place to go next than into the world of MACD. Why? Simple, the MACD is comprised of two moving averages. Some traders argue that there is no better technical indicator than that of the MACD, more often than not, this author tends to agree. The theory behind MACD is really the same theory behind trading any other form of a moving average cross. Generally a technical analyst can learn more from the interaction of two moving averages than he or she can learn from a single moving average in and of itself.
The MACD uses two exponential moving averages, more specifically a 12 day EMA and a 26 day EMA. The 12 day EMA is of course going to react to the market more quickly than will the 26 day EMA. When prices in the market begin to rise or trend upwards the 12 EMA will of course increase faster than will the 26 day. Visually this results in a MACD that is slanted upwards. Conversely when prices fall or trend downwards the opposite will occur and the 12 day EMA will decrease faster than will the 26 day, creating an obvious visual slant downwards. The MACD does oscillate at what would be considered a zero line. In other words, the MACD is either above or below the level that can be considered the third part of the equation. Some analysts refer to this line as the signal line, or the trigger line. Essentially this line is usually a 9 day exponential moving average of the actual MACD itself.
Whether you are a mathematician or not is hardly the point. One need not really understand the complexities of the calculations within a MACD, but rather it is only crucial to understand the basics of the math and what the MACD is trying to tell us as technical traders. For that reason, we will not further dissect the math. Instead, let us get to the point; how does a MACD forecast successful trades?
As is the case with trading moving average crosses, buy and sell signals derived from a MACD will come from the crossing of two lines. However, these two lines are not your two EMA lines, rather one is the combined level of the two EMA lines and the second is the signal, or trigger line (the 9 day exponential moving average of the actual MACD itself). The MACD crossing the signal line from above would indicate a buy order and conversely the MACD crossing the signal line from above would indicate a sell order.